

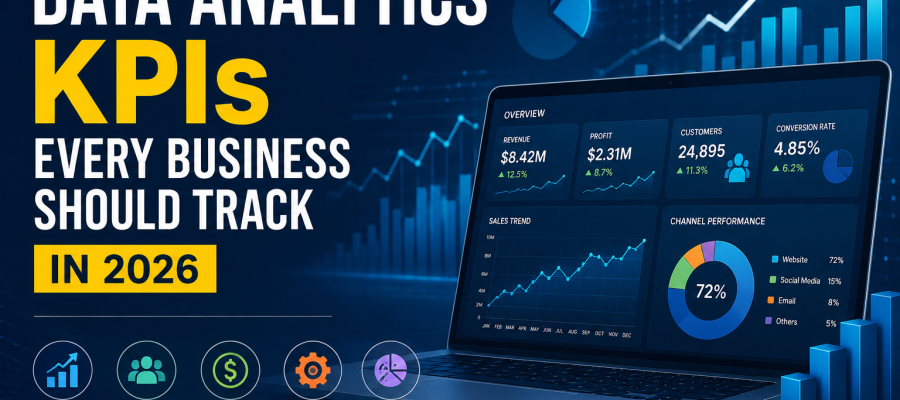
Businesses today generate a massive amount of data every single day. Every action—like a customer buying something, visiting a website, clicking an ad, or making a payment—creates useful information. But raw data alone does not help much. It only becomes valuable when businesses understand it and use it in the right way.
This is where Data Analytics KPIs become very important.
KPIs (Key Performance Indicators) help companies understand how their business is performing in real terms. Instead of guessing or assuming, businesses can look at actual numbers and clearly see what is working and what is not. This makes decision-making more practical, simple, and reliable.
Today, most companies are moving towards Data Driven Decision Making. This simply means making decisions based on data instead of opinions or personal judgment. It helps businesses reduce mistakes, improve planning, and grow in a more stable and controlled way.
As digital tools are becoming common, Business Analytics is now used in almost every industry. It helps companies understand customer behavior, improve sales, manage operations, and track financial performance in a structured way. It gives leaders a clear picture of how the business is performing.
Data is no longer just about reports. It is about understanding what is happening and taking action at the right time.
Why KPIs Are Important Today (Explained in Simple Points)
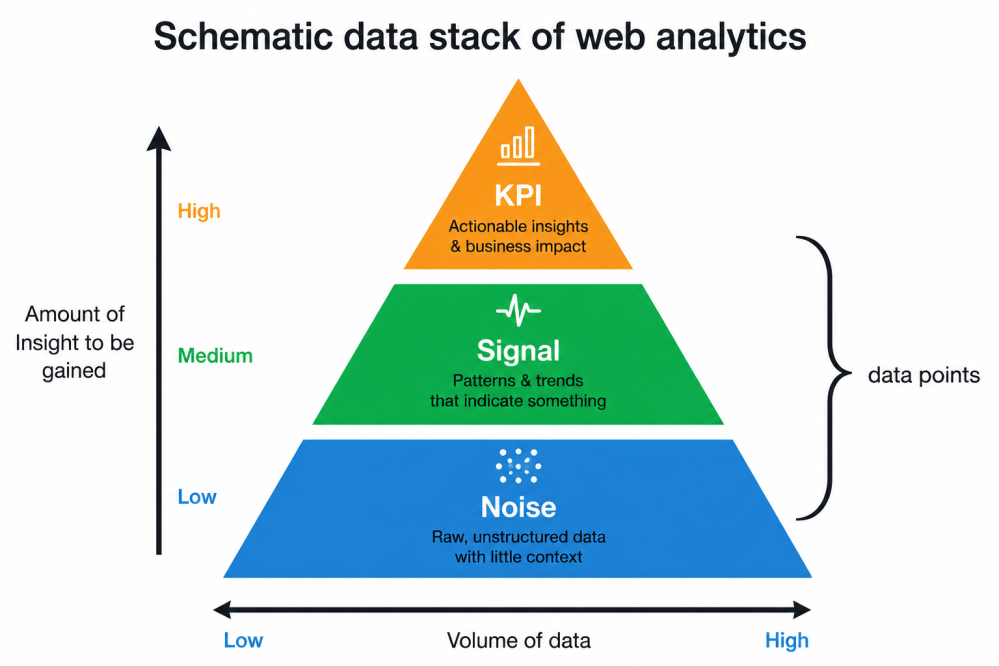
Businesses collect a large amount of data every day, but not all of it is useful. KPIs help filter out the important information so companies can focus only on what really matters for growth.
1. Website Traffic vs Conversion Rate
- Website traffic simply shows how many people visited a site.
- But conversion rate shows how many of them actually bought something or completed an action.
This helps businesses understand real success, not just visits.
2. Sales Numbers vs Profit
- Sales numbers show how much a company is selling.
- Profit shows how much money is actually left after expenses.
A business can have high sales but still lose money if costs are too high.
3. Customer Feedback
- Customer feedback shows how people feel about the product or service.
This helps businesses improve quality, service, and customer experience.
When companies follow KPI Tracking properly, they can:
- Monitor performance regularly
- Identify problems early
- Improve team productivity
- Stay focused on business goals
This makes business operations clearer and more organized.
How Business Decision-Making Is Changing in 2026
The business world in 2026 is very fast-moving. Customer expectations are changing quickly, and competition is increasing everywhere. Because of this, businesses need real-time and accurate information to make decisions.
Decision Intelligence (Explained Simply)
Decision Intelligence means combining data, technology, and business knowledge to make better decisions.
Instead of reacting after a problem happens, businesses can plan ahead and avoid risks.
Real Time Reporting
Earlier, companies used to wait for weekly or monthly reports. Now they can see updates instantly.
This helps businesses react quickly when something changes, like:
- Drop in sales
- Change in customer behavior
- Market fluctuations
AI Powered Analytics
AI tools help businesses understand data in a smarter way. They can:
- Predict future sales trends
- Identify customer buying patterns
- Detect risks early
- Find hidden insights in data
This makes decision-making more accurate and future-focused.
Enterprise Analytics
Large companies use Enterprise Analytics to combine data from different departments like:
- Finance
- Sales
- Marketing
- Operations
This gives a complete view of the business in one place.
Digital Transformation Metrics
These metrics help businesses understand how well new digital tools are working.
They show whether technology is improving:
- Efficiency
- Customer experience
- Business performance
Revenue and Financial KPIs Every Business Should Monitor
Financial health is one of the most important signs of how well a business is really doing. A company may have strong sales or growing customers, but in the end, what matters most is simple—are we actually making money, and is the business stable for the long run?
That’s why financial KPIs are so important.
Today, businesses don’t just look at revenue and feel satisfied. They need to understand the full picture—profit, expenses, cash flow, and how efficiently money is being used. Without this clarity, even a growing business can face serious problems later.
Revenue Growth KPI
A Revenue Growth KPI shows how fast a company’s income is increasing over time—monthly, quarterly, or yearly.
In simple terms, it answers one question:
“Is the business growing or not?”
This KPI helps companies understand whether their efforts in sales, marketing, and customer acquisition are actually working. If revenue is going up consistently, it usually means customers are interested and business strategies are on the right track.
But revenue alone doesn’t tell the full story.
A business also needs to understand why revenue is changing. Is it because of new customers? Better pricing? Seasonal demand? Or market expansion? Looking at these factors helps companies make smarter decisions instead of just celebrating numbers.
When businesses track Revenue Growth regularly, they can:
- Understand growth trends
- Plan future strategies better
- Spot problems early
- Improve decision-making
Profitability Metrics
Making money is important—but keeping money is even more important.
Profitability Metrics help businesses understand how much profit they actually earn after all expenses.
For example, a company might have high sales, but if expenses are also high, profit can still be low.
Some common Profitability Metrics include:
- Gross profit margin
- Net profit margin
- Operating profit
- EBITDA
These numbers help businesses understand how efficiently they are running.
In simple terms:
Revenue shows how much you earn
Profit shows how much you keep
By tracking profitability regularly, businesses can:
- Control unnecessary costs
- Improve pricing decisions
- Manage expenses better
- Build long-term stability
A healthy profit means a business can survive tough times and still grow in the future.
Financial Performance Indicators
Every business needs a clear way to understand its financial condition. That’s where Financial Performance Indicators come in.
These indicators give a complete picture of how strong or weak a company’s financial position is.
Some important examples include:
- Cash flow (money coming in and going out)
- Working capital (available funds for daily operations)
- ROI (return on investment)
- Debt levels
- Operating expenses
Together, these help businesses understand:
“Are we financially safe and stable?”
If these indicators are strong, it means the business can grow confidently. If they are weak, it’s a warning sign that changes are needed.
By tracking these regularly, companies can:
- Plan future investments better
- Reduce financial risks
- Improve budgeting
- Make more confident decisions
Management Reporting (Why It Matters)
Tracking numbers is one thing, but understanding them clearly is even more important.
This is where Management Reporting helps.
It brings all financial data into one place in a simple format—like dashboards or summary reports—so leaders don’t have to go through complicated spreadsheets.
Good management reporting helps teams:
- See overall business performance at a glance
- Compare actual results with targets
- Understand trends easily
- Make faster decisions
It also improves transparency across departments because everyone works with the same information.
Final Understanding
In the end, financial KPIs are not just numbers on a report. They are signals that show how healthy a business really is.
When companies track:
- Revenue Growth KPI
- Profitability Metrics
- Financial Performance Indicators
they get a complete understanding of their financial situation.
This helps them avoid surprises, plan better, and build a business that is not just growing—but also stable and sustainable in the long run.
Customer-Focused KPIs That Help Businesses Grow
Every successful business has one thing in common—happy customers. No matter how strong a product or service is, a company can only grow when customers trust it, keep coming back, and recommend it to others.
That’s why Customer-Focused KPIs are so important. They help businesses understand what customers really think, how they behave, and what can be improved to build stronger relationships.
Instead of guessing, companies can use real data to improve customer experience and long-term growth.
Why Customer KPIs Matter
Customers are the heart of every business. When customers are satisfied, they stay longer, spend more, and bring in new customers through recommendations.
Customer-focused KPIs help businesses:
- Understand customer needs
- Improve service quality
- Increase customer loyalty
- Grow revenue in a stable way
In simple words, these KPIs help businesses stay connected to their customers.
Customer Acquisition KPI
A Customer Acquisition KPI shows how well a business is able to bring in new customers.
It answers a simple question:
“How easily are we attracting new customers?”
To understand this better, businesses look at things like:
- Customer Acquisition Cost (CAC)
- Conversion rate (how many leads become customers)
- Website or ad performance
- Marketing return on investment (ROI)
These numbers help companies see which marketing efforts are actually working and which ones are wasting money.
For example, if one ad campaign brings more customers at a lower cost, businesses can focus more on that channel.
A strong acquisition strategy helps a business grow faster, but it should also be cost-effective. Spending too much to gain customers can reduce overall profit.
Customer Retention KPI
Getting new customers is important, but keeping them is even more valuable.
A Customer Retention KPI helps businesses understand how many customers stay with them over time.
It includes things like:
- Repeat purchase rate
- Customer retention rate
- Churn rate (customers leaving)
- Subscription renewals
- Customer lifetime value
In simple terms, it shows whether customers are happy enough to stay.
If retention is high, it usually means:
- Customers trust the brand
- Product or service is good
- Customer support is working well
And when customers stay longer, businesses don’t need to spend as much on marketing. This leads to better profit and stability.
Customer Satisfaction Metrics
Sometimes numbers alone are not enough. Businesses also need to understand how customers feel.
That’s where Customer Satisfaction Metrics help.
These include:
- Net Promoter Score (NPS) – Would customers recommend the business?
- Customer Satisfaction Score (CSAT) – Are customers happy with their experience?
- Customer Effort Score (CES) – How easy is it for customers to use the service?
These feedback tools help businesses understand real customer emotions and experiences.
For example:
- A low satisfaction score may show poor service
- A high NPS may show strong brand loyalty
When businesses act on this feedback, they can improve products, services, and overall customer experience.
How These KPIs Work Together
Customer KPIs are most powerful when used together:
- Customer Acquisition KPI → brings new customers
- Customer Retention KPI → keeps existing customers
- Customer Satisfaction Metrics → improves customer experience
When all three are strong, the business naturally grows in a healthy way.
This directly improves overall Business Growth Metrics, which shows how fast and how well a business is expanding.
Operational KPIs That Improve Business Efficiency
Every business wants to run smoothly. When work flows properly, teams perform better, costs stay under control, and customers get faster and better service. This is what we call operational efficiency.
In simple terms, operational efficiency means doing more with less waste—less time, less effort, and fewer resources.
To achieve this, businesses rely on Operational KPIs.
These KPIs help companies understand how their daily work is actually performing and where improvements are needed.
Why Operational KPIs Matter
Even a strong business can struggle if its internal processes are slow or unorganized. Operational KPIs help identify these hidden problems.
They help businesses:
- Improve daily workflow
- Reduce unnecessary costs
- Increase team productivity
- Deliver better customer service
- Make processes faster and smoother
In short, they help businesses work smarter, not harder.
Employee Productivity KPI
One of the most important operational KPIs is Employee Productivity.
It simply shows how effectively employees are completing their work and contributing to business goals.
For example:
- How many tasks are completed on time
- How much work each employee handles
- How efficiently projects are delivered
- Attendance and time management
- How well resources are being used
This KPI helps managers understand whether teams are working efficiently or facing challenges.
If productivity is low, it may indicate:
- Lack of proper training
- Poor workload balance
- Process delays
- Communication gaps
When businesses track productivity regularly, they can:
- Improve training programs
- Assign tasks more effectively
- Support employees better
- Build stronger teamwork
Over time, this leads to better performance and a more motivated workforce.
Operational Efficiency Metrics
Operational Efficiency Metrics focus on how smoothly business processes are running.
They answer a simple question:
“Are we using our time and resources properly?”
These metrics include:
- How fast work gets completed (cycle time)
- How well resources are used
- Inventory movement and control
- Daily operational costs
- Speed of service delivery
When these areas improve, the entire business becomes more efficient.
For example:
- Faster processes mean quicker customer delivery
- Better resource use means less waste
- Lower costs mean higher profit
Businesses that monitor these metrics regularly can quickly identify where things are slowing down and fix them before they become bigger problems.
Business Performance Metrics
Beyond daily operations, companies also need to understand overall performance.
Business Performance Metrics give a big-picture view of how well the organization is functioning.
They help answer questions like:
- Is the business growing or not?
- Are teams meeting goals?
- Is performance improving over time?
These metrics connect different departments and help leadership understand how the entire business is performing as a whole.
Business Monitoring Metrics
Modern businesses don’t just check performance once in a while—they monitor it continuously.
Business Monitoring Metrics help track operations in real time.
This means companies can:
- Spot issues early
- React quickly to problems
- Keep performance stable
- Avoid delays and losses
For example, if a process suddenly slows down or costs increase, monitoring systems can highlight it immediately so action can be taken.
This kind of real-time awareness helps businesses stay more flexible and responsive.
How These KPIs Work Together
Operational KPIs work best when used together:
- Employee Productivity KPI → measures team performance
- Operational Efficiency Metrics → improves processes
- Business Performance Metrics → shows overall results
- Business Monitoring Metrics → ensures real-time control
When all these are tracked properly, businesses run more smoothly, waste less time, and achieve better results.
How KPI Dashboards Turn Data Into Actionable Insights
Today’s businesses deal with a huge amount of data every day. Every customer order, website visit, ad click, sales transaction, and operational activity creates useful information. But the truth is simple—data by itself does not help a business grow.
What really matters is how that data is understood and used.
That’s where KPI Dashboards come in.
A KPI Dashboard brings all important business numbers into one place so teams don’t have to go through multiple reports or spreadsheets. Instead of getting lost in data, businesses can quickly see what is happening and take action when needed.
In simple words, dashboards turn confusing data into clear information.
Why KPI Dashboards Are Important
Businesses need quick answers today. Waiting for long reports can slow down decisions and create missed opportunities.
A KPI Dashboard helps by showing:
- What is performing well
- What is not working
- Where problems are starting
- What needs attention right now
This makes decision-making faster and more confident.
Managers and teams can check performance anytime and understand the situation in seconds instead of hours.
Dashboard Visualization (Making Data Easy to Understand)
One of the biggest benefits of dashboards is how they present information visually.
Instead of showing long numbers and tables, Data Visualization turns information into:
- Charts
- Graphs
- Progress bars
- Scorecards
- Heat maps
This makes complex data much easier to understand, even for non-technical people.
For example:
- Sales growth can be seen in a line chart
- Team performance can be shown in scorecards
- Customer behavior can be tracked using visual patterns
When data is visual, it becomes easier to spot trends, problems, and opportunities quickly.
It also improves communication between teams because everyone can understand the same information without confusion.
Reporting Automation (Saving Time and Reducing Errors)
Earlier, companies had to create reports manually. Employees would spend hours collecting data, checking spreadsheets, and preparing reports. This process often took too much time and sometimes included mistakes.
Now things have changed.
With Analytics Reporting automation, businesses can:
- Automatically collect data
- Update reports in real time
- Reduce manual work
- Avoid human errors
- Save a lot of time
Instead of waiting for weekly or monthly reports, teams can now see live updates instantly.
This helps businesses react faster when something changes, like:
- A drop in sales
- A sudden rise in customer demand
- A problem in operations
Automated reporting also ensures that everyone in the company is looking at the same accurate data, which reduces confusion and improves trust in the numbers.
Executive Visibility (Big Picture for Leaders)
Top management does not need every small detail. They need a clear and simple view of overall business performance.
This is where an Executive Dashboard becomes useful.
It gives leaders a quick overview of:
- Financial performance
- Sales and revenue trends
- Customer growth
- Operational efficiency
- Business goals progress
Instead of going through multiple reports, executives can understand the full situation in one screen.
This helps them:
- Make faster decisions
- Identify risks early
- Allocate resources better
- Track business goals clearly
- Respond quickly to challenges
When combined with an Analytics Dashboard, leaders also get deeper insights into what is driving growth or causing problems.
How Everything Works Together
A strong dashboard system works like a complete control center for a business:
- KPI Dashboard → shows overall performance in one place
- Data Visualization → makes data easy to understand
- Analytics Reporting → keeps data updated automatically
- Executive Dashboard → gives leadership a clear overview
When all these elements work together, businesses get a clear and real-time understanding of their performance.
Advanced Analytics KPIs for Future-Ready Businesses
Business is changing very fast. Earlier, companies mostly looked at past reports to understand performance. But today, that is not enough. Businesses don’t just want to know what already happened—they want to understand what might happen next.
That is why advanced analytics has become so important.
Modern organizations are now focusing on predictive and forward-looking systems that help them plan better, reduce risks, and make smarter decisions for the future.
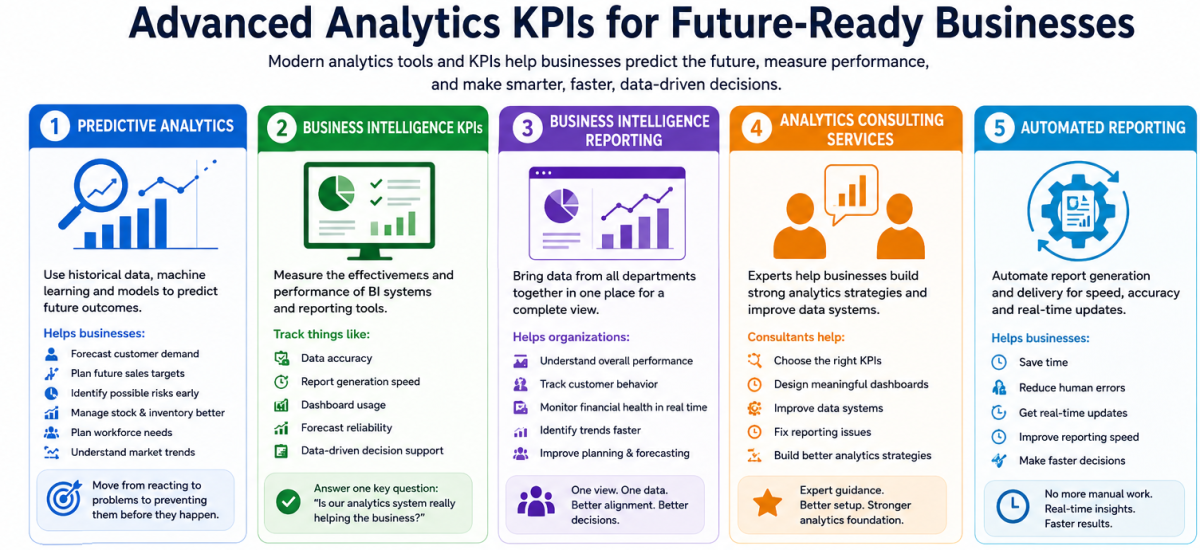
Predictive Analytics
Predictive Analytics is one of the most powerful tools in modern business analytics.
In simple terms, it helps businesses “predict the future” using past data.
Instead of only looking at what happened yesterday or last month, Predictive Analytics tries to answer questions like:
- What will happen next month?
- How will customers behave in the future?
- Will sales go up or down?
- Where could problems appear?
It works using historical data, machine learning, and statistical models.
Businesses use it for many practical purposes, such as:
- Forecasting customer demand
- Planning future sales targets
- Identifying possible risks early
- Managing stock and inventory better
- Planning workforce needs
- Understanding market trends
For example, if a business notices that demand increases during certain months, Predictive Analytics can help prepare stock and resources in advance.
This helps companies move from reacting to problems to preventing them before they happen.
Business Intelligence KPIs
As companies start using more advanced tools, they also need a way to measure how effective those tools are.
This is where Business Intelligence KPIs become useful.
These KPIs help businesses understand whether their data systems and reporting tools are actually useful or not.
They help track things like:
- How accurate the data is
- How fast reports are generated
- How often dashboards are used
- How reliable forecasts are
- How well decisions are supported by data
In simple terms, these KPIs answer one question:
“Is our analytics system really helping the business or not?”
When companies track these properly, they can improve their reporting systems and make better use of their data.
Business Intelligence Reporting
In today’s world, businesses don’t work in just one system. They have multiple departments like sales, finance, marketing, and operations—all generating different types of data.
Business Intelligence Reporting helps bring all this information together in one place.
Instead of looking at separate reports, businesses get a complete view of performance in a single system.
This helps organizations:
- Understand overall business performance
- Track customer behavior more clearly
- Monitor financial health in real time
- Identify trends faster
- Improve planning and forecasting
When all departments work with the same data, decision-making becomes more consistent and accurate.
Analytics Consulting and Automated Reporting
Not every company has in-house experts for data and analytics. That’s why many organizations take help from Analytics Consulting professionals.
These experts help businesses:
- Choose the right KPIs
- Design dashboards that make sense
- Improve data systems
- Fix reporting issues
- Build better analytics strategies
This is especially helpful for companies that are growing quickly or going through digital transformation.
Along with this, Automated Reporting is becoming very common.
Earlier, employees had to prepare reports manually, which took time and sometimes led to mistakes. Now, automated systems do this work automatically.
Automated Reporting helps businesses:
- Save time
- Reduce human errors
- Get real-time updates
- Improve reporting speed
- Make faster decisions
For example, instead of waiting for a monthly report, managers can now see updated dashboards anytime they want.
How These Tools Work Together
All these advanced analytics tools are connected:
- Predictive Analytics helps plan the future
- Business Intelligence KPIs measure system performance
- Business Intelligence Reporting gives a complete view of data
- Analytics Consulting improves strategy and setup
- Automated Reporting ensures speed and accuracy
When used together, they create a strong and reliable data system for businesses.
Common KPI Tracking Mistakes Businesses Should Avoid
KPIs are extremely useful for understanding how a business is performing. They help companies measure progress, improve decision-making, and stay aligned with goals. But in real life, many businesses still don’t get the full benefit of KPIs—not because KPIs are weak, but because they are not used properly.
Most problems come from how they are selected, tracked, and interpreted.
Let’s look at some common mistakes that businesses should avoid.
1. Tracking Too Many KPIs
One of the biggest mistakes companies make is trying to track too many KPIs at once.
At first, it may feel like more data means better control. But in reality, it often creates confusion.
When everything is important, nothing is important.
Too many KPIs can:
- Overload teams with information
- Make reporting complicated
- Shift focus away from real business goals
- Slow down decision-making
Instead, businesses should focus only on the KPIs that truly matter.
A simple and focused KPI system is always more effective than a long list of numbers that nobody uses properly.
2. Focusing on Vanity Metrics
Another common mistake is focusing on “vanity metrics.”
These are numbers that look good on paper but don’t actually help the business grow.
For example:
- A website getting lots of traffic sounds good
- But if visitors are not buying anything, it doesn’t help revenue
Similarly:
- Social media likes may increase
- But if sales don’t improve, business impact is low
This is why businesses need to look beyond surface-level numbers.
Instead of vanity metrics, companies should focus on real performance indicators like:
- Revenue growth
- Conversion rates
- Customer satisfaction
- Profit margins
These give a much clearer picture of real success.
3. Lack of Reporting Consistency
Even if a company chooses the right KPIs, problems can still happen if reporting is not consistent.
Sometimes different departments use different methods to calculate the same metric. This leads to confusion and conflicting reports.
For example:
- One team may calculate revenue monthly
- Another may calculate it weekly
- Another may use different data sources
This creates confusion and makes it hard to trust the numbers.
Consistent reporting is important because it ensures:
- Everyone is working with the same data
- Reports are easy to compare
- Decisions are more reliable
- Teams stay aligned
A proper Performance Measurement system always depends on clear and standard reporting rules.
4. Poor Data Management
KPIs are only as strong as the data behind them.
If the data is incorrect, outdated, or incomplete, then even the best KPIs will give wrong results.
Poor Data Management can lead to:
- Duplicate records
- Missing information
- Incorrect reporting
- Confusing dashboards
- Wrong business decisions
This is why strong data systems are very important.
Good Data Management ensures:
- Clean and accurate data
- Proper storage and organization
- Easy access across departments
- Better security and control
When data is managed properly, KPI Tracking becomes more reliable and useful for decision-making.
How These Mistakes Affect Business Performance
When businesses make these mistakes, they often face:
- Slow decision-making
- Confusion in reports
- Poor strategic planning
- Missed growth opportunities
But when these issues are fixed, KPI Tracking becomes a powerful tool for improving Performance Measurement and overall business efficiency.
Building a KPI Framework for Long-Term Success
Having KPIs in a business is not enough. Many companies track numbers, but still struggle to grow because those KPIs are not connected properly to real business goals.
That’s why a KPI framework is important.
A KPI framework simply means a clear structure that explains:
- Which KPIs to track
- Why they matter
- How they connect to business goals
- How often they should be reviewed
When this structure is strong, businesses become more focused, organized, and consistent in their decision-making.
1. Selecting the Right KPIs
The first step is choosing the right Business KPIs.
Not every number is useful for every business. KPIs should match what the company actually wants to achieve.
Good KPIs usually reflect:
- Business priorities
- Customer needs
- Operational goals
- Growth targets
For example:
- A sales company may focus on revenue and conversion rate
- A service company may focus on customer satisfaction
- An operations team may focus on efficiency and delivery time
The key idea is simple:
Only track what truly helps the business move forward.
A common mistake is choosing KPIs just because they are easy to measure. But easy does not always mean useful.
2. Aligning KPIs with Business Goals
Once KPIs are selected, they must be connected to the bigger business goals.
This is where Strategic KPIs come in.
Strategic KPIs ensure that:
- Daily work supports long-term goals
- Every department works in the same direction
- Performance is measured in a meaningful way
For example:
If a company’s goal is growth, then teams should not only focus on activity but also on results like revenue, customer retention, and market expansion.
When KPIs are aligned properly, employees clearly understand:
“How does my work impact the company?”
This improves:
- Team coordination
- Responsibility
- Focus on results instead of just tasks
3. Using Decision Intelligence
Today’s businesses need to make decisions quickly, but also correctly. This is not always easy when data is large and complex.
This is where Decision Intelligence helps.
In simple words, Decision Intelligence means using:
- Data
- Technology
- Business knowledge
together to make better decisions.
Instead of guessing or reacting late, businesses can:
- Understand patterns faster
- Predict possible outcomes
- Reduce uncertainty
- Take more confident decisions
For example:
If sales are dropping, Decision Intelligence can help identify whether the issue is pricing, customer demand, or competition.
This makes decision-making more practical and less risky.
4. Regular Review and Improvement
Business goals are not fixed forever. They change with time, market conditions, and customer needs.
That’s why KPI frameworks also need regular updates.
Companies should frequently check:
- Are these KPIs still useful?
- Do they match current goals?
- Are they showing the right results?
If not, they should be adjusted.
Management Reporting plays a big role here because it helps businesses:
- Track progress clearly
- Compare performance over time
- Identify problems early
- Improve planning
When reporting is clear and consistent, leaders can make better and faster decisions.
How Everything Works Together
A strong KPI framework connects all parts of the business:
- Business KPIs → what to measure
- Strategic KPIs → why it matters
- Decision Intelligence → how to decide better
- Management Reporting → how to track progress
When all these elements work together, businesses become more organized and result-focused.
Conclusion
- In today’s fast-changing and competitive business world, Data Analytics KPIs have become a key part of how organizations understand their performance and make decisions. Almost every business now collects large amounts of data every day, but the real value is not in collecting data—it is in understanding it and using it in the right way.
- When companies track the right KPIs, they get a much clearer idea of what is happening inside their business. It helps them understand customer behavior, check how well operations are working, measure financial performance, and identify areas where improvement is needed. This clarity makes decision-making easier and more practical.
- As businesses continue to move towards digital systems, Business Analytics is playing a much bigger role than before. Instead of depending only on traditional reports or assumptions, companies are now using data-driven insights to guide their strategies. This helps them stay more flexible and better prepared for changes in the market.
- Modern tools like KPI Dashboard systems have also made things simpler. Instead of going through long reports, teams can now see important business metrics in one place. This saves time and helps leaders react quickly when something needs attention.
- At the same time, Predictive Analytics is helping businesses look beyond the present. It allows companies to understand possible future trends, customer needs, and risks in advance. This forward-looking approach helps businesses plan better and avoid unexpected challenges.
- Overall, companies that use Data Analytics KPIs properly are in a stronger position to grow steadily. They can improve efficiency, make better decisions, and build stronger customer relationships. In the long run, this leads to more stability, better performance, and sustainable success in 2026 and beyond.
Frequently Asked Questions
1. What are Data Analytics KPIs?
Data Analytics KPIs are measurable performance indicators that help businesses evaluate progress, identify trends, and make data-driven decisions. They provide actionable insights across financial, operational, and customer-focused activities.
2. Which Data Analytics KPIs should businesses track in 2026?
Businesses should focus on Revenue Growth KPI, Customer Acquisition KPI, Customer Retention KPI, Employee Productivity KPI, Operational Efficiency Metrics, and Financial Performance Indicators to measure overall business performance and growth.
3. How does a KPI Dashboard improve business decision-making?
A KPI Dashboard provides real-time visibility into key business metrics through data visualization and automated reporting. It helps leadership teams monitor performance, identify issues quickly, and make informed decisions.
4. What is the difference between KPIs and data analytics metrics?
Data analytics metrics measure specific activities or outcomes, while KPIs are strategic metrics directly linked to business objectives. KPIs help organizations focus on the measurements that drive business success.
5. How can Predictive Analytics improve KPI tracking?
Predictive Analytics uses historical and real-time data to forecast future trends, customer behavior, and business outcomes. It helps organizations anticipate challenges, identify opportunities, and improve the accuracy of KPI-driven decision-making.