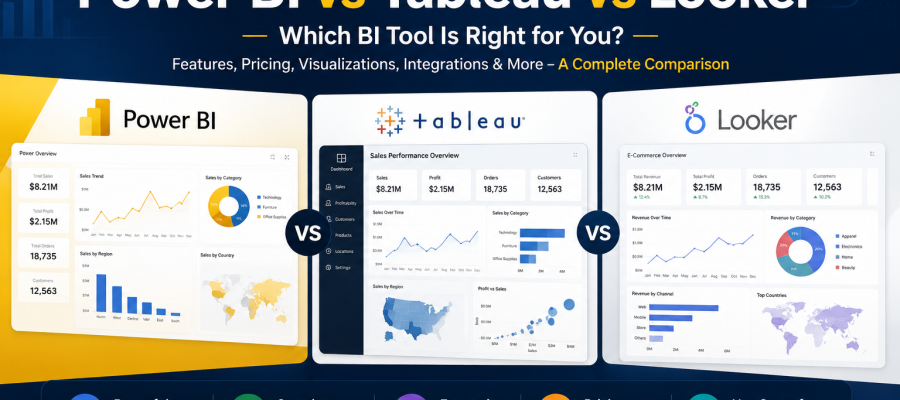
Power BI vs Tableau vs Looker – Which BI Tool Is Right for You?

Businesses today rely heavily on data to make faster and smarter decisions. Whether it is tracking sales performance, understanding customer behavior, analyzing marketing campaigns, or monitoring operational efficiency, companies now depend on Business Intelligence tools to transform raw data into meaningful insights.
Among the most popular BI platforms in the market today are Power BI, Tableau, and Looker. Each platform offers powerful analytics capabilities, interactive dashboards, and advanced data visualization features. However, choosing the right tool is not always simple because every business has different goals, technical requirements, budgets, and reporting needs.
This is why the topic of Power BI vs Tableau comparison has become increasingly important for businesses, startups, analysts, and enterprise organizations looking to invest in the right analytics platform.
Some companies prefer Power BI because of its Microsoft ecosystem integration and affordability. Others choose Tableau for advanced data visualization and interactive dashboards. Meanwhile, Looker has become popular among cloud based businesses that want modern data modeling and real time analytics.
The right BI tool can improve reporting efficiency, enhance collaboration, reduce manual work, and support better data driven decision making. On the other hand, choosing the wrong platform may create scalability challenges, integration issues, and unnecessary operational costs.
In this detailed guide, we will compare Power BI, Tableau, and Looker across features, pricing, visualization capabilities, ease of use, scalability, integrations, security, and business use cases to help you understand which platform fits your business needs best.
What Is Business Intelligence and Why Does It Matter?
Business Intelligence, commonly known as BI, refers to technologies and processes used to collect, analyze, visualize, and report business data.
Modern BI tools help businesses:
- Track KPIs
- Monitor business performance
- Create dashboards
- Analyze customer behavior
- Improve forecasting
- Support strategic decision making
Without BI tools, companies often struggle with:
- Manual reporting
- Disconnected data sources
- Slow decision making
- Limited visibility into operations
This is why businesses increasingly invest in platforms like Power BI, Tableau, and Looker to centralize analytics and simplify reporting processes.
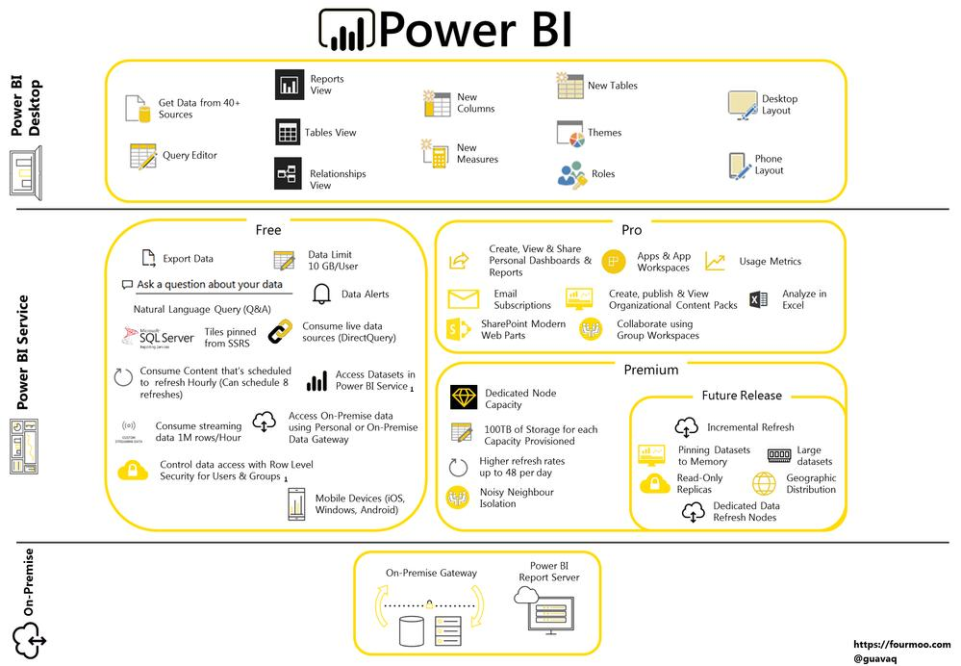
What Is Power BI?
Power BI is Microsoft’s Business Intelligence platform designed for data visualization, reporting, and dashboard creation.
It is widely used because of:
- Affordable pricing
- Strong Microsoft integration
- Easy dashboard creation
- Cloud and desktop support
- Integration with Excel and Azure
Power BI is especially popular among small and medium businesses already using Microsoft products.
Some major Power BI features include:
- Interactive dashboards
- Real time reporting
- AI powered insights
- Data modeling
- Custom visualizations
- Cloud analytics
One of the biggest advantages of Power BI is its user friendly interface, making it suitable for both technical and non technical users.
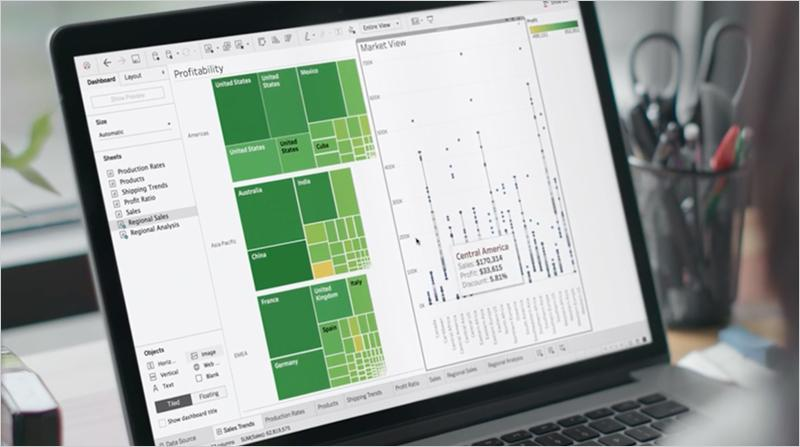
What Is Tableau?
Tableau is one of the most recognized data visualization platforms in the world.
It is known for:
- Advanced visual analytics
- Interactive dashboards
- Drag and drop functionality
- Large data handling capabilities
- Strong visualization flexibility
Tableau focuses heavily on helping businesses explore and visualize data through highly customizable reports and dashboards.
Many enterprises choose Tableau because it offers:
- Advanced analytics
- Powerful visualization options
- Strong community support
- Enterprise scalability
- Multi source data integration
Tableau is especially popular among data analysts and large organizations that require deeper data exploration capabilities.
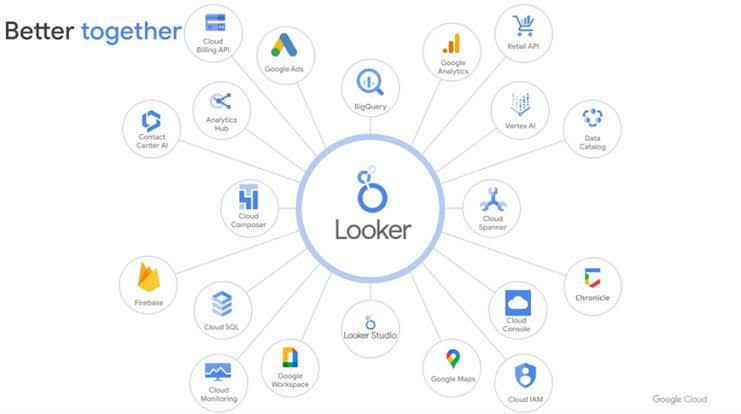
What Is Looker?
Looker is a cloud based Business Intelligence platform owned by Google Cloud.
Unlike traditional BI tools, Looker focuses strongly on:
- Cloud analytics
- Real time reporting
- Centralized data modeling
- Embedded analytics
- SQL based exploration
Looker works especially well for organizations already using cloud data warehouses like:
- BigQuery
- Snowflake
- Redshift
One major difference in the Power BI vs Tableau comparison is that Looker uses a modeling language called LookML, which helps businesses create consistent and centralized reporting structures.
Looker is often preferred by modern digital businesses and enterprises with strong cloud infrastructures.
Power BI vs Tableau Comparison: Ease of Use
Ease of use is one of the biggest factors businesses consider before choosing a BI platform.
Power BI
Power BI is considered beginner friendly because:
- Interface feels similar to Microsoft Office tools
- Excel users adapt quickly
- Dashboard creation is straightforward
- Lower learning curve
Non technical business users can often start using Power BI without advanced technical skills.
Tableau
Tableau offers excellent drag and drop functionality, but:
- Advanced features require learning
- Visualization customization may take time
- Beginners may initially feel overwhelmed
However, once users become familiar with Tableau, it provides very powerful analytical flexibility.
Looker
Looker is generally more technical compared to Power BI and Tableau.
Users often need:
- SQL knowledge
- Data modeling understanding
- Cloud infrastructure familiarity
This makes Looker better suited for technically mature organizations.
Power BI vs Tableau Comparison: Data Visualization
Visualization quality is one of the most important areas in Business Intelligence.
Power BI Visualization Features
Power BI provides:
- Interactive dashboards
- Basic to advanced charts
- KPI tracking
- Real time visuals
While highly effective, some advanced visual customization options remain limited compared to Tableau.
Tableau Visualization Features
Tableau is widely considered the leader in data visualization.
It offers:
- Highly interactive dashboards
- Advanced visual storytelling
- Flexible chart customization
- Sophisticated data exploration
This makes Tableau extremely popular among analysts and enterprise reporting teams.
Looker Visualization Features
Looker focuses more on:
- Embedded analytics
- Cloud reporting
- Centralized reporting consistency
Although visualization is strong, it is generally considered less visually advanced than Tableau.
Which BI Tool Is Better for Large Data Handling?
Modern businesses often work with massive datasets.
Power BI
Power BI performs well with medium to large datasets but may require optimization for very large enterprise scale operations.
Tableau
Tableau handles large datasets more efficiently than many traditional BI platforms.
It supports:
- Faster visual processing
- Better scalability
- Complex analytical queries
Looker
Looker is highly optimized for cloud based large scale data processing.
Since queries run directly on cloud warehouses, Looker can manage massive datasets efficiently.
This is one reason many enterprises prefer Looker for modern cloud analytics environments.
Power BI vs Tableau Comparison: Pricing
Pricing is one of the biggest deciding factors for businesses.
Power BI Pricing
Power BI is generally considered the most affordable option.
Benefits include:
- Lower entry costs
- Affordable enterprise scaling
- Cost effective Microsoft integration
This makes Power BI attractive for startups and small businesses.
Tableau Pricing
Tableau is more expensive than Power BI.
However, businesses often justify the cost because of:
- Advanced analytics
- Better visualization
- Enterprise features
Large enterprises with complex reporting requirements commonly invest in Tableau.
Looker Pricing
Looker pricing is typically enterprise focused and may be expensive for smaller businesses.
Its cost depends heavily on:
- Data usage
- Cloud infrastructure
- Custom implementation
Looker is usually adopted by medium to large cloud based organizations.
Which BI Tool Offers Better Integration?
Business Intelligence platforms must connect with multiple data sources.
Power BI Integrations
Power BI integrates extremely well with:
- Excel
- Azure
- Microsoft Teams
- SharePoint
- SQL Server
Organizations already using Microsoft ecosystems often prefer Power BI.
Tableau Integrations
Tableau supports:
- Multiple databases
- Cloud services
- APIs
- Enterprise systems
Its integration flexibility is very strong.
Looker Integrations
Looker is designed specifically for cloud data environments.
It integrates well with:
- Google BigQuery
- Snowflake
- Redshift
- Google Cloud services
Cloud native companies often choose Looker for this reason.
Power BI vs Tableau Comparison: AI and Automation
AI powered analytics is becoming increasingly important.
Power BI AI Features
Power BI offers:
- AI powered insights
- Natural language queries
- Automated trend detection
Microsoft continues expanding AI integration within Power BI.
Tableau AI Features
Tableau includes:
- Predictive analytics
- AI driven recommendations
- Automated data explanations
Its AI capabilities continue improving rapidly.
Looker AI Features
Looker benefits heavily from Google Cloud AI technologies.
Businesses can combine Looker with:
- BigQuery ML
- Google AI tools
- Advanced cloud automation
This creates strong AI driven analytics capabilities.
Which BI Tool Is Best for Small Businesses?
For small businesses, cost and ease of use are critical.
Best Option: Power BI
Power BI is usually the best fit because:
- Affordable pricing
- Easy implementation
- Microsoft integration
- Beginner friendly interface
Small businesses can start quickly without heavy technical investment.
Which BI Tool Is Best for Enterprises?
Large enterprises often require:
- Advanced analytics
- Massive data handling
- Complex reporting
- Enterprise governance
Best Option: Tableau or Looker
Tableau is excellent for:
- Advanced visual analytics
- Enterprise dashboards
- Analytical flexibility
Looker is ideal for:
- Cloud based enterprises
- Centralized data governance
- Real time cloud analytics
Which BI Tool Is Best for Cloud Analytics?
Cloud analytics continues growing rapidly.
Best Option: Looker
Looker is specifically designed for cloud native analytics environments.
It works exceptionally well with:
- Google Cloud
- BigQuery
- Modern data warehouses
Businesses heavily invested in cloud ecosystems often prefer Looker.
Power BI vs Tableau Comparison: Security and Governance
Data security is essential for modern businesses.
Power BI Security
Power BI includes:
- Microsoft security integration
- Role based access
- Compliance certifications
Tableau Security
Tableau provides:
- Enterprise grade governance
- Secure data sharing
- Permission management
Looker Security
Looker focuses strongly on centralized governance and cloud security frameworks.
This helps enterprises maintain consistent reporting standards across teams.
What Are the Main Differences Between Power BI, Tableau, and Looker?
Here is a simplified comparison:
| Feature | Power BI | Tableau | Looker |
|---|---|---|---|
| Best For | Small to Medium Businesses | Enterprise Analytics | Cloud Analytics |
| Ease of Use | Beginner Friendly | Moderate Learning Curve | Technical Users |
| Visualization | Strong | Excellent | Good |
| Pricing | Affordable | Expensive | Enterprise Pricing |
| Cloud Integration | Good | Good | Excellent |
| AI Features | Strong | Strong | Advanced Cloud AI |
| Customization | Moderate | High | High |
| Microsoft Integration | Excellent | Moderate | Limited |
How Should Businesses Choose the Right BI Tool?
Businesses should evaluate several factors before selecting a BI platform.
Important considerations include:
- Budget
- Technical expertise
- Existing infrastructure
- Reporting complexity
- Cloud adoption
- Data volume
- Scalability needs
For example:
- Startups may prefer Power BI
- Data heavy enterprises may choose Tableau
- Cloud first organizations may adopt Looker
The best platform depends on long term business goals and operational requirements.
Future Trends in Business Intelligence
Business Intelligence continues evolving rapidly.
Some important trends include:
- AI powered analytics
- Self service BI
- Real time dashboards
- Embedded analytics
- Cloud native reporting
- Predictive analytics
- Automated insights
All three platforms continue investing heavily in AI and automation capabilities.
The future of BI will focus more on:
- Faster decision making
- Real time intelligence
- Personalized analytics
- Simplified user experiences
Conclusion
The discussion around Power BI vs Tableau comparison is important because every business has unique reporting and analytics needs.
Power BI stands out for affordability, Microsoft integration, and ease of use. Tableau remains a leader in advanced visualization and enterprise analytics. Looker excels in cloud based modern data environments and centralized data modeling.
There is no single platform that is perfect for every organization. The right choice depends on:
- Business size
- Technical requirements
- Budget
- Data infrastructure
- Long term scalability goals
Businesses that carefully evaluate these factors can select a BI platform that improves reporting efficiency, enhances data visibility, and supports smarter strategic decision making in today’s competitive digital environment.
Frequently Asked Questions
1. Which is better: Power BI or Tableau?
Power BI is better for affordability and Microsoft integration, while Tableau is better for advanced data visualization and enterprise analytics.
2. Is Looker better than Power BI?
Looker is stronger for cloud native analytics environments, while Power BI is easier and more cost effective for general business reporting.
3. Which BI tool is easiest to learn?
Power BI is generally considered the easiest BI tool for beginners.
4. Why do enterprises prefer Tableau?
Enterprises often prefer Tableau because of advanced visualization, scalability, and deep analytical flexibility.
5. Is Looker only for Google Cloud users?
No, but Looker works especially well with Google Cloud and modern cloud data warehouses.
Ready to Build Smarter Dashboards and Better Decisions?
Ready to Build Smarter Dashboards and Better Decisions?
Our BI specialists can help you evaluate, implement, and optimize the right solution for your business.Power BI ImplementationTableau Dashboards Looker Analytics Solutions KPI & Executive Reporting