
Data analytics is not a single activity. It includes multiple approaches that help organizations understand data from different angles. Each type of data analytics answers a different kind of question and plays a specific role in decision-making. Together, these types form the foundation of modern analytics services, business intelligence systems, and big data analytics environments.
At a high level, data analytics can be divided into four main types. These types are not isolated. Most real-world analytics systems use a combination of them, depending on data maturity, availability, and business goals. Understanding these types helps clarify how data analytics solutions actually work in practice.
As data volumes increase and systems become more complex, organizations rely on structured analytics approaches rather than ad-hoc analysis. This is where data analytics consulting, analytics frameworks, and data engineering foundations become important, even when the focus remains purely informational.
What Is Descriptive Analytics and Why Is It the Starting Point?
Descriptive analytics focuses on understanding what has already happened. It is the most basic and widely used type of data analytics. Almost every organization begins its analytics journey here, often without realizing it.
Descriptive analytics works by summarizing historical data into meaningful formats such as reports, dashboards, and visualizations. These outputs help teams track performance, monitor trends, and gain visibility into operations. Business intelligence systems are largely built on descriptive analytics principles.
Common examples include monthly sales reports, website traffic summaries, operational performance dashboards, and financial statements. Data visualization plays a key role here because humans understand patterns more easily through charts and graphs than raw numbers.
From a data perspective, descriptive analytics relies heavily on structured data stored in databases, data warehouses, or big data platforms. Data warehouse implementation and proper data collection processes ensure that historical data remains accurate and consistent over time.
Although descriptive analytics does not explain why something happened, it creates the foundation for deeper analysis. Without a clear understanding of past outcomes, more advanced analytics becomes unreliable.
Diagnostic Analytics: Understanding Why Something Happened
While descriptive analytics shows what happened, diagnostic analytics explains why it happened. This type of analytics digs deeper into data to identify causes, relationships, and contributing factors behind observed outcomes.
Diagnostic analytics often involves comparing datasets, segmenting data, and identifying correlations. For example, if sales drop in a particular region, diagnostic analytics helps determine whether the cause was pricing, supply issues, customer behavior, or operational delays.
This type of analytics depends on well-organized data pipelines and reliable ETL pipeline processes. Data extraction, data cleansing, and data preparation are critical here because inaccurate or incomplete data can lead to false conclusions.
Diagnostic analytics is widely used across industries such as healthcare, retail, logistics, and finance. In many real-world scenarios, it works alongside business intelligence services to provide deeper insights beyond standard reporting.
As organizations grow, diagnostic analytics becomes more important than basic reporting. It supports better problem-solving and helps decision-makers move away from assumptions toward evidence-based reasoning.
Predictive analytics focuses on what is likely to happen next. Instead of only analyzing past and present data, it uses historical patterns to estimate future outcomes. This marks a shift from reactive decision-making to proactive planning.
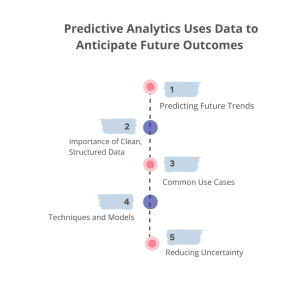
Predicting Future Trends
Predictive analytics uses historical patterns to estimate what is likely to happen next. It helps organizations move from reactive decisions to proactive planning.
Importance of Clean, Structured Data
Reliable predictions depend on well-organized historical data stored in warehouses, data lakes, or big data platforms. Strong data engineering is essential for accuracy.
Common Use Cases
Predictive analytics is applied in demand forecasting, risk assessment, customer behavior analysis, and performance prediction. Large datasets improve prediction accuracy.
Techniques and Models
It often employs statistical methods and machine learning models to identify patterns. The goal is practical: to prepare for future scenarios, not just react.
Reducing Uncertainty
While it cannot eliminate uncertainty, predictive analytics highlights probabilities and trends, allowing organizations to make more confident decisions in complex situations.
Prescriptive Analytics and How It Guides Decision-Making
Prescriptive analytics goes one step further by recommending what actions should be taken. It combines insights from descriptive, diagnostic, and predictive analytics to guide decisions.
Rather than just presenting information, prescriptive analytics evaluates multiple options and suggests optimal outcomes based on defined objectives and constraints. This type of analytics is commonly used in advanced analytics systems and real-time data analytics environments.
Key characteristics of prescriptive analytics include:
- Uses historical and real-time data together
- Builds on predictive models to simulate outcomes
- Evaluates different decision scenarios
- Supports automation in complex systems
- Often integrates with stream data models and architectures
Prescriptive analytics is closely linked to advanced data analytics solutions and analytics maturity. Organizations usually adopt it after building strong foundations in data engineering, ETL pipelines, and data warehousing.
In real-world environments, prescriptive analytics is applied gradually. It starts with decision support and evolves toward automated recommendations as trust in analytics grows.
What Is the Role of ETL Pipelines in Analytics Systems?
ETL pipelines play a central role in making data usable for analytics. ETL stands for extract, transform, and load. It describes how data moves from source systems into analytics-ready storage systems.
First, data is extracted from different sources such as applications, websites, sensors, or enterprise systems. This data often arrives in different formats and quality levels. Next, the data is transformed. This step includes cleaning errors, removing duplicates, standardizing formats, and applying business rules. Finally, the transformed data is loaded into a data warehouse, big data platform, or real-time analytics system.
ETL pipelines support all analytics types. Descriptive analytics relies on ETL to maintain clean historical records. Diagnostic analytics depends on consistent transformations to compare datasets. Predictive analytics needs structured historical data to train models. Prescriptive analytics requires reliable pipelines to support real-time or near real-time decisions.
Modern ETL pipeline architecture is often automated. Automation reduces manual effort and errors while improving scalability. As data volumes grow, ETL pipelines become more complex but also more important.
Understanding what an ETL pipeline is helps explain why analytics systems are not just about reports or dashboards. They are built on continuous data movement and preparation.
Key Components That Enable Modern Analytics Systems
Modern analytics systems are built from multiple components working together. These components support different analytics types and data speeds.
Core components include:
-
Data collection systems that capture data from various sources
-
ETL pipelines that extract, transform, and load data
-
Data warehouses for structured analytics and reporting
-
Big data platforms for large-scale and complex datasets
-
Stream data models for real-time data processing
-
Data visualization layers that present insights clearly
Each component plays a specific role. Data engineering technologies ensure data flows smoothly across systems. Data warehousing in the real world focuses on consistency and historical accuracy. Big data analytics environments focus on scale and speed.
These components are not separate silos. They form a connected analytics ecosystem. When designed correctly, they support descriptive, diagnostic, predictive, and prescriptive analytics together.
How Real-Time Data Analytics Changes Decision-Making?
Real-time data analytics analyzes data as it is generated instead of waiting for batch processing. This approach changes how decisions are made, especially in time-sensitive situations.
Real-time analytics relies on stream data models and streaming architectures. Data flows continuously through pipelines and is analyzed immediately. This allows organizations to detect issues, trends, or opportunities as they occur.
Compared to traditional reporting, real-time analytics supports faster responses. It is often used in monitoring systems, customer interactions, operational tracking, and anomaly detection. While not every use case requires real-time insights, some decisions lose value when delayed.
Real-time analytics still depends on strong data engineering and ETL principles. The difference is speed and processing style. Instead of periodic data loads, systems handle continuous streams.
Understanding real-time analytics helps complete the picture of modern data analytics systems and how they support different decision timelines.
Conclusion: Bringing Data Analytics Types and Systems Together
Data analytics is not just about analyzing numbers. It is a structured journey that combines different analytics types with strong data foundations. Descriptive analytics explains what happened. Diagnostic analytics explains why it happened. Predictive analytics estimates what may happen next. Prescriptive analytics suggests what actions to take.
These analytics types depend on data engineering, ETL pipelines, data warehouses, big data platforms, and real-time data systems. Each layer adds reliability, scale, and speed to analytics outcomes.
As organizations grow in analytics maturity, they move from basic reporting toward advanced analytics supported by strong data infrastructure. This progression allows analytics to become a core part of everyday decision-making.
Understanding how analytics types connect with data systems helps build realistic expectations and stronger long-term data strategies.
FAQ : Frequently Asked Questions
When should a business invest in data analytics services instead of in-house analytics?
Businesses typically invest in data analytics services when they need faster deployment, specialized expertise in big data platforms, or scalable analytics without long-term hiring costs.
How does data analytics consulting improve ROI for growing enterprises?
Data analytics consulting aligns data strategy with business goals, reduces inefficiencies, and ensures analytics solutions deliver measurable operational and financial impact.
Why are data engineering services critical before scaling analytics initiatives?
Without strong data engineering services, analytics initiatives face data quality issues, slow pipelines, and unreliable insights, which limits the return on analytics investments.
How do advanced data visualization services support executive decision-making?
Advanced data visualization services convert complex datasets into clear, actionable dashboards, helping leadership teams identify trends, risks, and opportunities faster.