In today’s data-driven world, organizations generate massive amounts of information every day. Making sense of this data is critical for smart decision-making, which is where business intelligence dashboards and reporting come into play. Dashboards and reports are tools that help translate raw data into meaningful insights. They allow teams to see trends, monitor performance, and make decisions backed by real information rather than intuition.
For beginners, understanding dashboards and reports can seem overwhelming, but breaking them down into clear concepts makes it much easier. A dashboard is essentially a visual interface that consolidates multiple data sources and presents key metrics in one place. Reports provide in-depth analysis, explaining the data trends and offering context for decision-making. When used together, they create a powerful system that supports both operational monitoring and strategic planning.
What Are BI Dashboards and Reports?
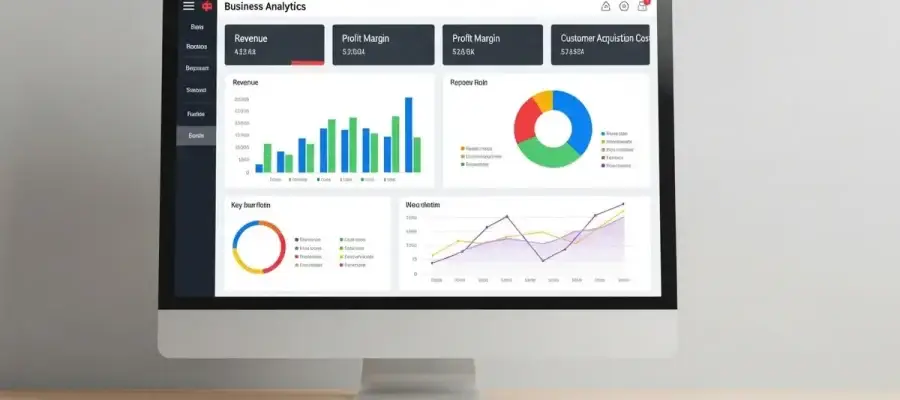
BI dashboards are visual representations of data that help users quickly grasp important information. They often include charts, graphs, and tables that display KPIs, trends, and exceptions. Reports, on the other hand, provide detailed summaries and narratives that explain why the data looks the way it does.
While dashboards are great for real-time monitoring, reports are essential for historical analysis and documentation. Organizations that use both effectively can ensure that daily operations are optimized while long-term strategic goals remain on track.
How Do BI Dashboards Improve Decision-Making?
Dashboards simplify decision-making by allowing users to see critical metrics at a glance. They enable interactive exploration, letting users filter data, drill down into specifics, and spot trends that might not be obvious in raw data.
Key benefits of dashboards include:
- Quick access to real-time performance indicators
- Clear visualization of trends and patterns
- Identification of anomalies and outliers easily
- Consolidation of data from multiple sources in a single view
- Ability to communicate insights across teams efficiently
These advantages help organizations make faster, smarter decisions, allowing managers to act proactively and improve business outcomes.
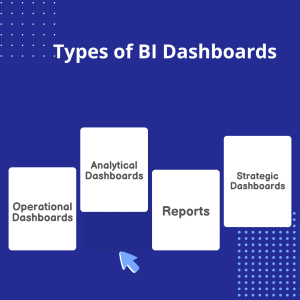
Operational Dashboards
Focus on day-to-day monitoring of activities, such as sales, inventory, or customer service, helping teams track performance in real time.
Analytical Dashboards
Allow users to explore historical data and trends, providing insights for root-cause analysis and deeper understanding of business patterns.
Strategic Dashboards
Highlight long-term objectives and KPIs, helping executives monitor overall business performance and align with organizational goals.
Reports
Provide detailed data, context, and explanations to help decision-makers understand why trends occur and how to respond. They are also valuable for compliance, auditing, and cross-team collaboration.
Challenges in Implementing BI Dashboards and Reports
Implementing dashboards and reporting comes with challenges. Without accurate, clean data, dashboards and reports can be misleading. Integrating data from multiple sources, ensuring user adoption, and keeping dashboards and reports aligned with business goals require planning and maintenance.
- Data quality must be consistent across all sources
- Integration of multiple systems can be complex
- Overloading dashboards with information can reduce clarity
- Regular maintenance is required to keep insights relevant
- Aligning dashboards and reports with business objectives is critical
By addressing these challenges proactively, organizations can ensure their dashboards and reports deliver real value rather than becoming static tools.
Advanced BI Dashboards and Reporting
Building on the foundation of dashboards and reports, it becomes essential to dive deeper into design strategies, real-time insights, and predictive analytics to fully leverage business intelligence tools. A well-structured BI system does more than just display data; it helps organizations interpret complex datasets, monitor performance metrics in real time, and make data-driven decisions with confidence. By focusing on intuitive design, clear visualization, and actionable insights, businesses can ensure that their teams not only access information but also understand it and act upon it effectively.
In addition to foundational dashboards and reporting, predictive analytics plays a critical role in shaping future strategies. Organizations can anticipate trends, forecast performance, and optimize resource allocation by integrating predictive models into their BI workflows. Real-world examples, such as retail companies predicting customer demand or financial institutions identifying risk patterns, demonstrate how BI reporting can transform raw data into strategic intelligence. By combining practical design approaches, best practices, and advanced analytics, businesses can maximize the value of their BI tools, improve operational efficiency, and maintain a competitive edge in a rapidly evolving market.
Designing Effective BI Dashboards
An effective dashboard communicates insights clearly, supports decision-making, and remains user-friendly. It is not just about displaying charts or graphs; it is about presenting actionable information in a concise manner.
Key principles for dashboard design include:
- Prioritizing important KPIs and metrics relevant to specific roles
- Maintaining a clean layout to avoid clutter
- Using appropriate visualizations for different types of data
- Enabling interactivity, such as filters and drill-down options
- Updating dashboards regularly to reflect current business conditions
Dashboards should be tailored to the audience. Executives may require strategic KPIs, while operational teams need real-time metrics for day-to-day tasks. Focusing on user experience ensures dashboards are widely adopted and consistently used, increasing the impact of BI initiatives.
Leveraging Real-Time Analytics in BI Reporting
Real-time analytics empowers businesses to respond immediately to changes and make proactive decisions. Instead of relying on weekly or monthly reports, teams can monitor live data streams, track performance, and detect issues as they arise. The benefits of real-time analytics include faster decision-making through current data, improving customer experience by addressing issues immediately, enhancing operational efficiency with timely insights, the ability to detect and resolve anomalies quickly, and aligning with fast-paced business environments. Integrating real-time data into dashboards ensures users are not just reacting to past events but can anticipate trends and act strategically, especially in areas like sales monitoring, supply chain management, and customer support.
Predictive Analytics for Business Intelligence
Predictive analytics elevates business intelligence by forecasting trends and outcomes using historical data and statistical models. This allows organizations to identify risks, opportunities, and patterns before they occur. Predictive dashboards combine forecasting with visualizations, enabling decision-makers to see expected sales and revenue trends, customer behavior predictions, inventory and supply chain demands, marketing campaign performance projections, and risk assessments along with mitigation strategies. By combining historical reporting, real-time insights, and predictive analytics, businesses gain a comprehensive view of past, present, and future performance. Predictive dashboards support proactive strategies, helping organizations optimize operations, reduce costs, and increase revenue.
Best Practices for BI Reporting Implementation
Implementing BI reporting systems requires careful planning, governance, and continuous monitoring. Without these, dashboards and reports can become ineffective or misleading. Best practices include defining clear objectives for the BI system, ensuring data quality and consistency across all sources, engaging end-users in the design process to meet their needs, using automated data pipelines to reduce manual errors, and maintaining regular updates while monitoring system performance. Following these practices ensures that BI dashboards and reports are actionable and enable data-driven decision-making across the organization.
Using BI Dashboards for Strategic Planning
When aligned with business goals, BI dashboards become powerful tools for strategy. They allow leadership to track performance, evaluate initiatives, and make evidence-based decisions. Dashboards contribute to strategic planning by highlighting trends and performance gaps, comparing results against objectives and benchmarks, supporting predictive planning for market changes, and enhancing collaboration by sharing insights across teams. Integrating dashboards into regular business reviews ensures that every decision is backed by accurate, timely, and relevant data, improving both operational and strategic outcomes.
Conclusion
Business intelligence dashboards and reporting tools are essential for organizations looking to leverage data for smarter decision-making. By combining clear dashboard design, real-time analytics, and predictive insights, companies can move beyond static reporting to proactive management. Implementing best practices, ensuring data quality, and tailoring dashboards to user needs enhances usability and adoption, creating measurable business impact.
As businesses continue to generate massive amounts of data, the role of BI dashboards in monitoring performance, forecasting trends, and supporting strategic planning becomes even more critical. Adopting modern BI solutions allows teams to stay agile, respond to opportunities quickly, and align operations with organizational goals.
Ultimately, a well-designed BI reporting system is not just a tool, but a foundation for data-driven culture, empowering decision-makers at all levels to act with confidence and precision. By integrating dashboards, analytics, and predictive modeling, organizations can unlock the full potential of their data assets.
Frequently Asked Questions (FAQs)
How can small businesses use BI dashboards to improve day-to-day operations?
They can consolidate sales, inventory, and customer data into dashboards for real-time monitoring and faster decisions.
What are the common mistakes when designing BI dashboards?
Overloading dashboards with metrics, ignoring the audience, and using inappropriate visualizations can reduce clarity and adoption.
How do predictive dashboards help in sales and marketing planning?
They forecast trends using historical and real-time data, helping teams anticipate demand, optimize campaigns, and allocate resources.
Can operational and strategic dashboards be combined?
Yes, integrating operational metrics with strategic KPIs allows both executives and teams to get actionable insights.
What role does real-time analytics play in customer support?
It helps teams identify and resolve issues immediately, track response times, and improve customer satisfaction proactively.
How do you ensure data quality across BI reporting sources?
Standardizing definitions, validation checks, and automated ETL pipelines keep data consistent and reliable.
How can predictive analytics reduce supply chain risks?
By forecasting demand or delays, it helps optimize inventory, prevent bottlenecks, and mitigate operational risks.
What are best practices for encouraging dashboard adoption?
Design clean interfaces, prioritize role-specific KPIs, provide training, and enable interactive features like filters and drill-downs.