

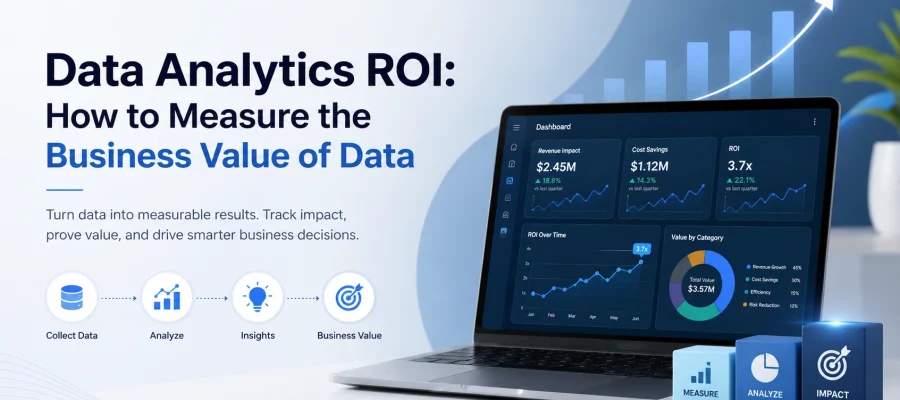
Introduction: Why Measuring Data Analytics ROI Matters
Businesses invest heavily in data today.
They invest in cloud platforms, dashboards, analytics tools, data engineering, Artificial Intelligence, and skilled professionals. However, one important question often remains unanswered:
What business value is the organization actually receiving from its data investment?
This is where Data Analytics ROI becomes important.
ROI, or Return on Investment, helps businesses compare the value created by an initiative with the cost required to deliver it.
Measuring the return on investment in data analytics can help leaders understand whether their technology and data initiatives are creating real business outcomes.
For example, a new analytics platform may help a company reduce operational costs. A predictive model may improve demand forecasting. An executive dashboard may reduce the time required to make important decisions.
These outcomes can create measurable value.
However, analytics ROI is not always easy to calculate. Some benefits, such as higher revenue or lower costs, can be measured directly. Others, such as faster decision-making or improved customer understanding, may take longer to quantify.
A successful measurement strategy should therefore look beyond dashboards and reports.
The real value of analytics comes from the decisions and actions that follow the insights.
In this guide, we will explain how businesses can measure the business value of data, identify important ROI metrics, and build a stronger case for continued investment in data analytics.
What Is Data Analytics ROI?
Data Analytics ROI measures the business value created through analytics compared with the cost of building, operating, and maintaining analytics capabilities.
The value may come from several areas, including:
- Higher revenue
- Lower operating costs
- Better productivity
- Improved customer retention
- Faster decision-making
- Reduced business risk
- Improved forecasting
- More efficient processes
A simple ROI calculation is:
ROI = (Value Generated − Investment Cost) ÷ Investment Cost × 100
The difficult part is not the formula.
The real challenge is determining what value the analytics initiative actually created.
For example, imagine a business spends ₹10 lakh on a new analytics solution.
After implementation, the solution helps reduce unnecessary inventory costs by ₹15 lakh.
The direct financial benefit is ₹15 lakh, while the investment cost is ₹10 lakh.
The organization can therefore calculate the financial return created by the initiative.
However, not every analytics project produces such a direct result.
An executive dashboard may save managers hundreds of hours each year. A customer analytics project may improve retention. A fraud analytics system may prevent financial losses.
This is why businesses need to identify both direct and indirect benefits.
Why the Business Value of Data Is Difficult to Measure
Many organizations know that data is important.
But importance and measurable value are not always the same thing.
One common mistake is measuring the success of an analytics initiative based only on technical outputs.
For example:
- Number of dashboards created
- Number of reports delivered
- Amount of data collected
- Number of users on a platform
- Number of AI models developed
These metrics may show activity, but they do not automatically show business value.
A company may have hundreds of dashboards that nobody uses.
Another company may have one dashboard that helps leaders reduce millions in unnecessary costs.
The difference is the business outcome.
To measure the business value of data, organizations should connect analytics initiatives with specific business goals.
Instead of asking:
“How many dashboards did we build?”
Ask:
“What business decision became faster or better because of this dashboard?”
Instead of asking:
“How much data do we collect?”
Ask:
“What action can the business take because of this data?”
This shift helps organizations focus on outcomes rather than technology alone.
The Main Ways Data Analytics Creates Business Value
Data analytics can create value in different parts of an organization.
The exact impact depends on the business model, industry, and analytics use case.
Revenue Growth
Analytics can help businesses understand customers and identify new opportunities.
For example, companies can analyze:
- Customer buying patterns
- Product demand
- Pricing performance
- Customer segments
- Marketing campaigns
- Sales performance
These insights can help teams improve targeting, increase conversion rates, and identify opportunities for growth.
Cost Reduction
Analytics can reveal unnecessary spending and inefficient processes.
Businesses can analyze operational data to identify areas where costs can be reduced without affecting performance.
Examples include:
- Inventory optimization
- Energy cost reduction
- Better resource allocation
- Reduced waste
- Improved procurement
Higher Productivity
Employees often spend significant time searching for data and preparing reports.
Automation and centralized dashboards can reduce this manual effort.
The time saved can be converted into measurable productivity gains.
Better Customer Retention
Customer analytics can help businesses identify customers who may stop purchasing or reduce engagement.
Teams can then take action before the customer is lost.
Risk Reduction
Analytics can help identify potential fraud, operational issues, supply chain disruptions, and financial risks.
Preventing a loss can also create measurable ROI.
How to Measure Data Analytics ROI
Measuring Data Analytics ROI requires a structured approach.
The process should begin before the analytics solution is implemented.
Step 1: Define the Business Problem
Start with a specific business challenge.
For example:
- High customer churn
- Excess inventory
- Slow reporting
- Increasing operational costs
- Poor sales forecasting
A clear problem makes it easier to measure the impact of the solution.
Step 2: Establish a Baseline
Measure the current situation before making changes.
For example:
- Current customer churn rate
- Current reporting time
- Current inventory costs
- Current revenue
- Current processing time
The baseline provides a comparison point.
Step 3: Define the Expected Outcome
Decide what success looks like.
For example:
- Reduce reporting time by 50%
- Improve demand forecast accuracy
- Reduce inventory costs by 10%
- Increase customer retention
- Improve campaign performance
Step 4: Measure the Business Impact
After implementation, compare the new results with the baseline.
The difference may represent the value created by analytics.
Step 5: Calculate the Total Cost
Include relevant costs such as:
- Technology
- Cloud infrastructure
- Data engineering
- Consulting
- Employee training
- Maintenance
- Ongoing operations
Step 6: Review and Improve
ROI measurement should continue after the project is completed.
Some benefits increase over time as adoption grows.
Important Metrics for Measuring Analytics ROI
The right metrics depend on the business objective.
However, several categories are useful.
Financial Metrics
These measure direct financial value.
Examples include:
- Revenue growth
- Cost savings
- Profit improvement
- Reduced losses
- Increased customer lifetime value
Operational Metrics
These measure efficiency.
Examples include:
- Processing time
- Cost per transaction
- Inventory levels
- Machine downtime
- Employee productivity
Customer Metrics
These measure customer impact.
Examples include:
- Customer retention
- Customer churn
- Conversion rates
- Customer satisfaction
- Repeat purchases
Analytics Adoption Metrics
A successful solution also needs to be used.
Useful measurements include:
- Active dashboard users
- Frequency of usage
- Number of business decisions supported
- Time saved by automation
However, usage should not be the final measure of success. It should be connected to business outcomes.
Direct ROI vs Indirect Business Value
Not every benefit from data analytics appears immediately in financial statements.
Some benefits are direct.
For example:
- A supply chain analytics project reduces transportation costs by ₹20 lakh.
- A fraud model prevents ₹10 lakh in losses.
- Inventory optimization reduces excess stock.
These benefits can often be measured financially.
Other benefits are indirect.
For example:
- Faster decision-making
- Better collaboration
- Improved confidence in data
- Less manual reporting
- Greater visibility into business performance
These benefits may not have an immediate monetary value.
However, businesses can often estimate their impact.
For example, if automation saves 500 employee hours per month, the organization can estimate the value of that time based on employee costs or the work that those employees can now perform.
A complete ROI strategy should therefore measure both direct financial impact and indirect operational value.
The Role of Business Intelligence in ROI Measurement
Business Intelligence plays an important role in measuring analytics performance.
A centralized BI environment can help organizations monitor:
- Revenue
- Costs
- Productivity
- Customer metrics
- Operational performance
- Project outcomes
Executive dashboards make this information easier to access.
Instead of waiting for monthly reports, leaders can track important metrics in near real time.
This improves visibility and makes it easier to identify whether an analytics initiative is delivering expected results.
For example, if a company invests in a predictive sales model, a dashboard can compare:
- Actual sales
- Forecasted sales
- Forecast accuracy
- Inventory availability
- Revenue impact
This creates a direct connection between the analytics solution and business performance.
Common Mistakes When Measuring Data Analytics ROI
Businesses can struggle to prove ROI because they measure the wrong things.
Here are some common mistakes.
Focusing Only on Technology
Buying a powerful analytics platform does not create value by itself.
The business value comes from how people use insights to take action.
Starting Without a Baseline
Without knowing the starting point, it becomes difficult to measure improvement.
Measuring Only Short-Term Results
Some analytics investments create value over months or years.
For example, building a strong data platform may support many future initiatives.
Ignoring Adoption
A technically successful solution can still fail if business users do not use it.
Not Including All Costs
ROI calculations should include implementation, maintenance, training, infrastructure, and ongoing support.
Using Too Many Metrics
Focus on the metrics that connect most directly to the original business problem.
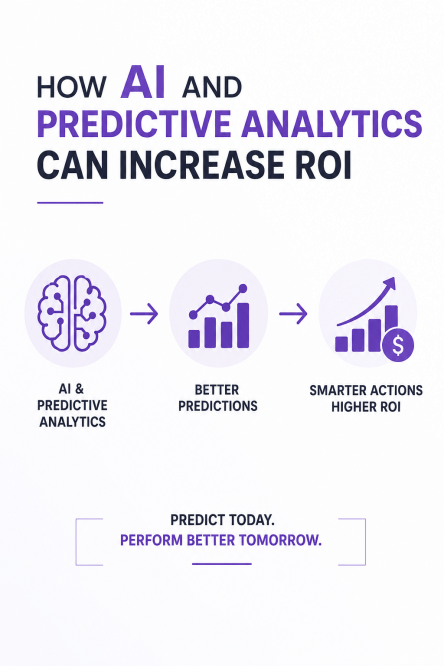
How AI and Predictive Analytics Can Increase ROI
Artificial Intelligence and predictive analytics can create additional business value when used with the right data foundation.
Predictive analytics helps businesses use historical information to estimate future outcomes.
Examples include:
- Sales forecasting
- Demand prediction
- Customer churn prediction
- Fraud detection
- Equipment failure prediction
The ROI comes from the action businesses can take before an event occurs.
For example, if a company can predict which customers are likely to leave, it can create targeted retention strategies.
If a manufacturer can predict equipment failure, it can schedule maintenance before a costly breakdown.
However, AI does not automatically create ROI.
Businesses still need:
- Clear business objectives
- High-quality data
- Strong data governance
- Measurable success metrics
- Business adoption
The best AI projects are connected to real business problems.
Building a Data Strategy Around Business Value
Organizations should not collect data simply because they can.
A strong data strategy connects data initiatives with business priorities.
Start by asking:
- What are our biggest business challenges?
- Which decisions are difficult to make today?
- Where are we losing time or money?
- What customer problems can we understand better?
- Which processes can be improved?
- What risks can we predict earlier?
These questions help organizations prioritize analytics initiatives.
For example, if the main business challenge is high operational costs, the analytics strategy should focus on efficiency and cost reduction.
If the main challenge is customer retention, the focus may be customer analytics and churn prediction.
This creates a direct connection between the data strategy and business value.
How Wisecor Transformations Helps Businesses Create Data Value
Technology investments should create measurable business outcomes.
At Wisecor Transformations, the focus is not simply on building dashboards or implementing tools. The goal is to help businesses use data to solve real operational and strategic challenges.
Our services include:
- Data Analytics Consulting
- Data Engineering
- Business Intelligence Solutions
- Cloud Data Analytics
- Artificial Intelligence and Machine Learning
- Predictive Analytics
- Data Integration
- Executive Dashboards
- Digital Transformation
We help organizations identify business opportunities, connect fragmented data, build scalable analytics environments, and create insights that support better decisions.
A successful analytics initiative begins with understanding the business problem.
From there, the right technology, data architecture, dashboards, AI models, or predictive analytics solutions can be selected based on the expected business outcome.
This approach makes it easier for organizations to connect data investments with measurable value.
The Future of Data Analytics ROI
The way businesses measure data value will continue to evolve.
Companies will increasingly move beyond measuring individual analytics projects.
Instead, they will evaluate how data improves the entire organization.
Future measurement may include:
- Faster AI deployment
- Better decision quality
- Increased automation
- Improved forecasting
- Higher productivity
- Lower operational risk
- Better customer experiences
- Greater data reuse
AI will also help businesses monitor analytics performance automatically.
Instead of manually reviewing reports, leaders may receive intelligent recommendations about where data investments are creating the most value.
However, one principle will remain the same:
Analytics should be measured by the business outcomes it creates.
Technology is important, but business impact is the final measure of success.
Conclusion
Data is one of the most valuable assets available to modern businesses.
However, data alone does not create value.
The value comes from how organizations transform information into better decisions and meaningful action.
Measuring Data Analytics ROI helps businesses understand whether their analytics investments are creating real results.
The most effective approach is to connect every major analytics initiative with a business objective.
This may include increasing revenue, reducing costs, improving productivity, retaining customers, reducing risk, or supporting faster decisions.
Organizations should establish a baseline, define measurable goals, track business outcomes, calculate total costs, and review results over time.
Not every benefit will appear immediately as revenue.
Faster decisions, improved productivity, stronger data quality, and reduced business risk can also create significant long-term value.
The future belongs to organizations that do not simply collect more data.
It belongs to organizations that understand how to measure, manage, and maximize the business value of data.
Wisecor Transformations helps businesses build modern data capabilities through Data Analytics, Data Engineering, Business Intelligence, Cloud Analytics, AI/ML, Predictive Analytics, Data Integration, and Digital Transformation.
The real question is no longer whether businesses should invest in data.
The question is:
How much measurable business value can your data create?
Frequently Asked Questions
1. What is Data Analytics ROI?
Data Analytics ROI measures the business value generated from analytics compared with the cost of the analytics investment.
2. How do you measure the ROI of data analytics?
Businesses can measure ROI by establishing a baseline, defining business goals, tracking financial and operational improvements, calculating total investment costs, and comparing the value generated with those costs.
3. What are the main benefits of data analytics?
Major benefits include better decision-making, revenue growth, cost reduction, improved productivity, stronger customer retention, better forecasting, and reduced business risk.
4. How can data analytics increase revenue?
Analytics can help businesses understand customers, identify sales opportunities, improve pricing, personalize marketing, and predict demand.
5. Why is it important to measure the business value of data?
Measuring business value helps organizations understand whether their data investments are creating meaningful outcomes and supports better decisions about future technology investments.
6. Can AI improve Data Analytics ROI?
Yes. AI and predictive analytics can improve ROI by automating processes, predicting future outcomes, detecting risks, and identifying opportunities. However, success depends on data quality, governance, adoption, and clear business goals.
7. How can Wisecor Transformations help businesses improve analytics ROI?
Wisecor Transformations helps businesses connect data initiatives with real business goals through Data Analytics Consulting, Data Engineering, Business Intelligence, Cloud Analytics, AI/ML, Predictive Analytics, Data Integration, and Digital Transformation solutions.